how to find support and resistance levels?
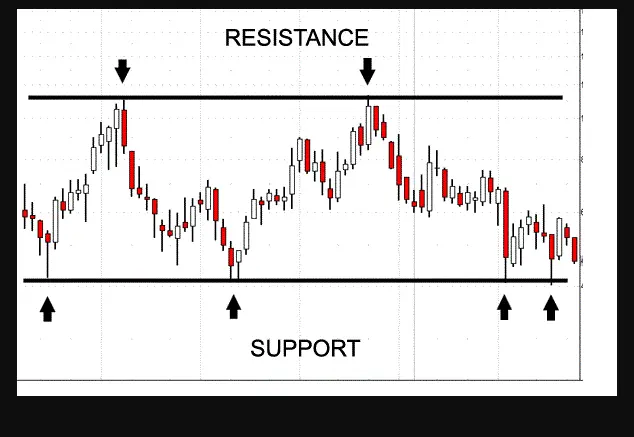
Support and resistance; are proven areas where buyers and sellers find some balance, as they are major turning points in the market.
Support and resistance levels; are formed when the price reverses and changes direction, and the price often respects these support and resistance levels, in other words, they tend to contain price action until the price breaks them of course.
In trend markets, support and resistance are made up of swing points. To the upside, the previous swing point acts as a support level, and in the downtrend, the old swing point acts as a resistance level.
When the market makes a retracement move, it respects the previous swing point (support level) which will mark the beginning of another impulsive move.
When the market tests its previous swing point (support level), it rises again. By drawing a support level in an uptrending market, we can predict when the next impulsive move will occur.
The market is making an impulsive movement. If you understand how price action works in a vector market, you will predict with great accuracy when the next impulsive move will start. Another way to catch the onset of an impulsive movement is to draw trend lines. This is another technical skill that you must learn if you want to identify a major linear support and resistance level.
Let me first show you what trend lines mean?
Often times when the market is in motion, which results in new highs and lows, the price tends to respect the linear level that is identified as the trend line. Bull markets will tend to create a linear support level, and bear markets will form a linear resistance level.


![Makato Ya NBC Bank Tanzania 2024 [Tariff guide, Charges & Fees] 13 Nbc](https://allglobalupdates.com/wp-content/uploads/2021/10/Capture-36-280x210.png.webp)

Leave a Reply